


AWS DynamoDB offers Scan and Query operations for retrieval of data items. Both the operations work differently not only in the terms how the data organization happens in background but also in terms of performance of the operation. CloudWatch Custom Metrics can help you plot a graph of the time taken for the DynamoDB operations - Scan or Query which would help you understand how the DynamoDB operations differ in terms of performance.
Key takeaways from the blog
- DynamoDB operations comparison - Scan vs Query.
- Implementation of Step Function based Lambda Function trigger.
- Implementation of CloudWatch Custom Metrics.
Implementation walk-through
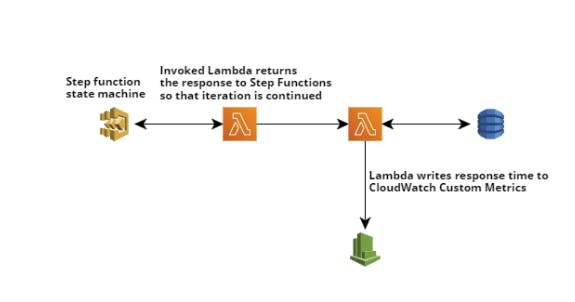
- Setting up Step-Functions to invoke the Lambda function.
- Step-Function triggered Lambda invokes another Lambda to query DynamoDB and log the response time.
- The response time is even written to CloudWatch Custom Metrics with Scan and Query comparison.
DynamoDB operations comparison - Scan vs Query
What is Scan?
Scan DynamoDB operation searches the complete table and then returns the data as it is stored in it's sequential form.
let scanResponse = await dynamodb.scan({
        "TableName": "cars-demo"
    }).promise()
What is Query?
Query DynamoDB operation uses KeyConditionExpression to leverage the data model with either table's key schema or the index schema which makes the query operation search on a defined condition.
let queryResponse = await dynamodb.query({
        TableName: 'cars-demo',
        IndexName: 'origin-index',
        KeyConditionExpression: 'origin = :origin',
        ExpressionAttributeValues: { ':origin': { "S": "USA" } },
    }).promise()
| Feature | Scan | Query |
| Searching technique | Sequential search | Partitioned search |
| Schema constraint mandatory | ❌ | ✅ |
| Indexes | ✅ | ✅ works better with LSI and GSI |
| Sorting | ❌ | ✅ sorts the data with the SortKey |
| Response limit | 1 MB | 1 MB |
| Response time | Slower | Faster |
| Computation | O(n) | log(n) |
| Cost | Expensive as each item is scanned | Cheaper |
Performance of the DynamoDB operations depend on the key factors -
- How the data is modeled.
- What are the FilterKeys used.
- Where the data is residing.
- Limit of data returned, if you cross 1 MB limit you would have to paginate the response.
Implementation of Step Function based Lambda Function trigger
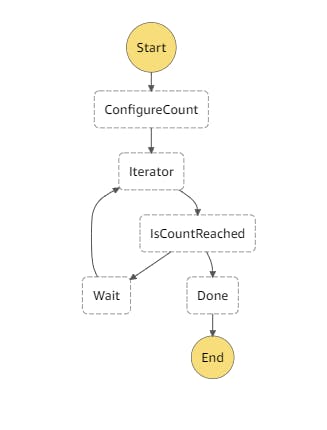
Step Function workflows define a state machine which is the skeleton for the process flow. In this implementation, we will be manually start the execution of the state machine where the configuration is initialized and it invokes the Lambda function. On Lambda's response back to Step-Functions, a conditional check is executed to check if the state machine has completed execution or not. If the condition fails, the state machine transitions to Wait state where it waits for 1 second and re-invokes the Lambda. This is continues until the condition is satisfied.
{
  "Comment": "Invoke Lambda every 1 second",
  "StartAt": "ConfigureCount",
  "States": {
    "ConfigureCount": {
      "Type": "Pass",
      "Result": {
        "index": 0,
        "count": 5000
      },
      "ResultPath": "$.iterator",
      "Next": "Iterator"
    },
    "Iterator": {
      "Type": "Task",
      "Resource": "arn:aws:lambda:ap-south-1:228628157461:function:dynamodb-monitoring-Iterator-S9CK3cTj2qii",
      "ResultPath": "$.iterator",
      "Next": "IsCountReached"
    },
    "IsCountReached": {
      "Type": "Choice",
      "Choices": [
        {
          "Variable": "$.iterator.continue",
          "BooleanEquals": true,
          "Next": "Wait"
        }
      ],
      "Default": "Done"
    },
    "Wait": {
      "Type": "Wait",
      "Seconds": 1,
      "Next": "Iterator"
    },
    "Done": {
      "Type": "Pass",
      "End": true
    }
  }
}
This state machine implementation is available on AWS blogs, click here which describes the architecture for a sub-minute frequency invocation of Lambda Function. There are some changes to this architecture we will not be using CloudWatch Event rule to invoke the Lambda function to begin State machine execution instead, it is a manually execution from the AWS Web console.
To execute the State machine, in the Step-Functions console navigate to the state machine created and click on start execution button. On clicking you will be prompted with an input JSON for the state machine (this is optional) and you can start the execution.
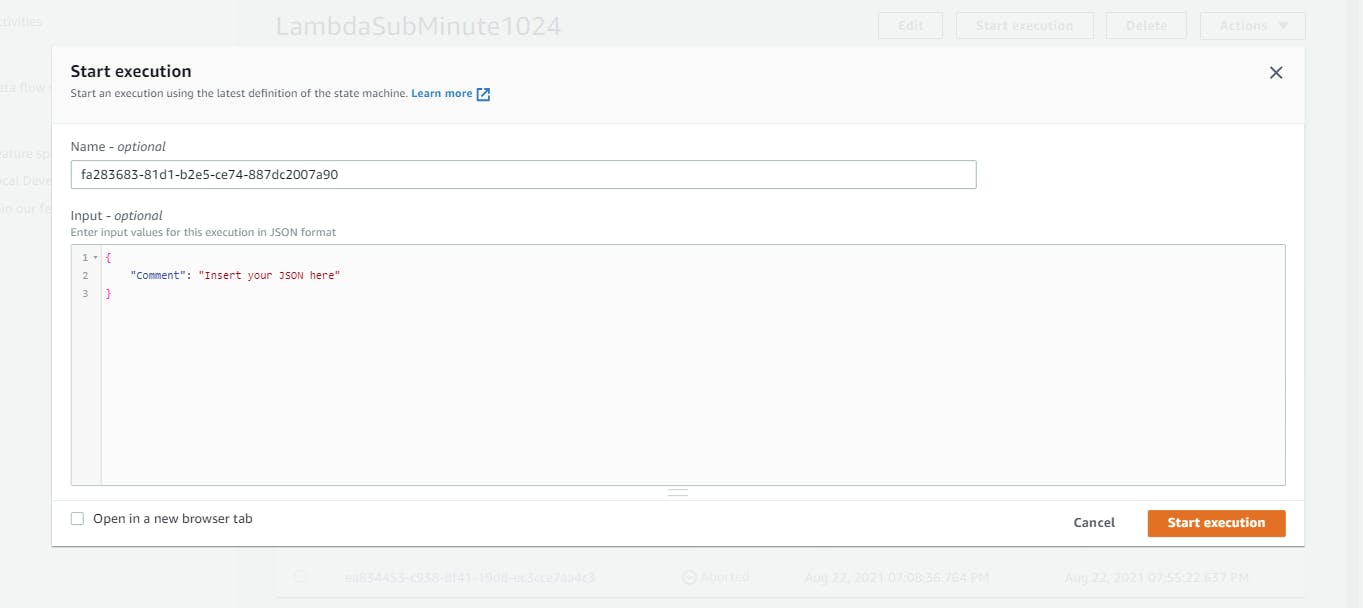
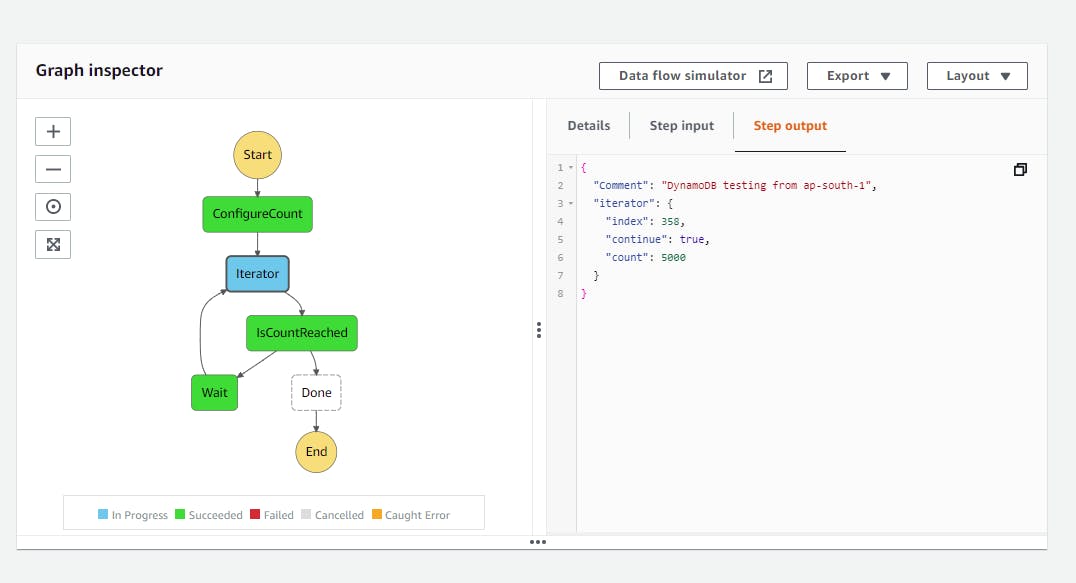
State machine execution in progress which shows the transition of states types - task, wait and choice and also you can view the input, output of each state execution.
Implementation of CloudWatch Custom Metrics
CloudWatch Custom Metrics is used for publishing user defined custom metrics to CloudWatch for generating graphical representation of data.
This CloudWatch Custom Metrics detailed implementation is available on AWS blogs, click here
In this implementation we will be publishing metric operations - SCAN or QUERY with the response time taken for that execution.
await cloudwatch.putMetricData({
        'MetricData': [{
            'MetricName': 'DynamoDBOperations',
            'Dimensions': [{
                'Name': 'OPERATION',
                'Value': metric
            }],
            'Unit': 'Milliseconds',
            'Value': value
        }, ],
        'Namespace': 'DynamoDB Queries and Scans'
    }).promise()
The published data would be available in CloudWatch console under the Metrics sub-menu.
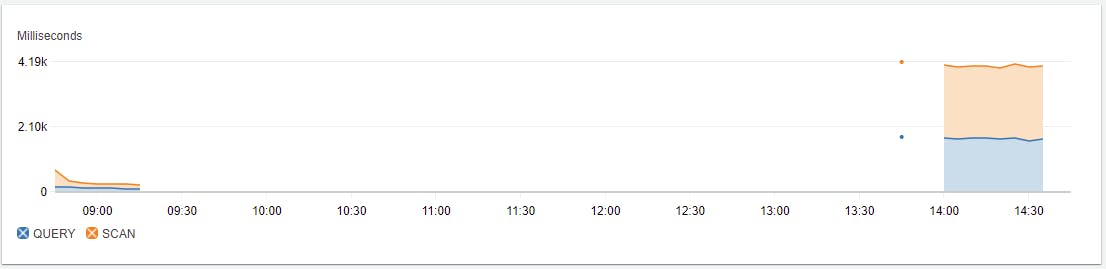
Custom metrics with DynamoDB operations executed from US-EAST-1 (in the same region where data resides in DynamoDB)
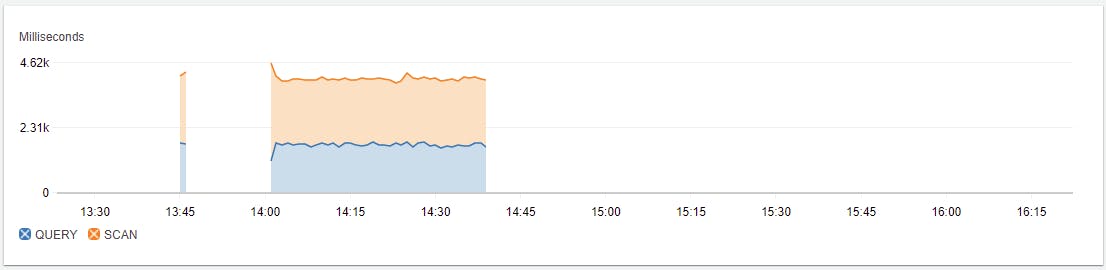
Custom metrics with DynamoDB operations executed from AP-SOUTH-1 (in a different region from where the data resides in DynamoDB)
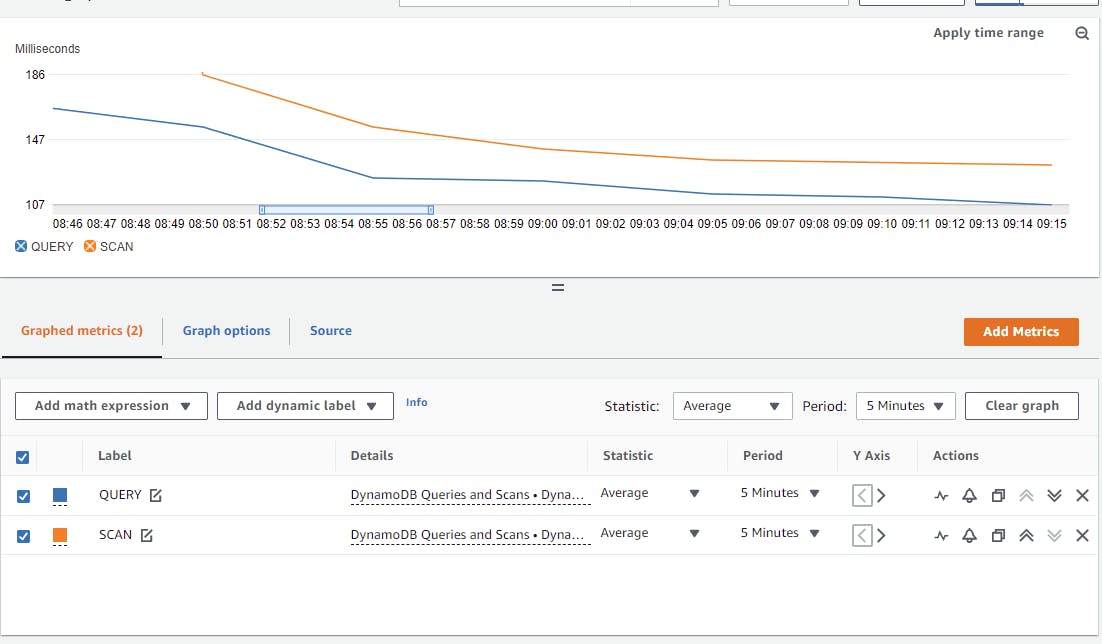
Custom metrics with DynamoDB operations executed from US-EAST-1 v/s AP-SOUTH-1
Infers from CloudWatch Custom Metrics.
- It is quiet obvious that queries are much faster than scan operations.
- The region also plays a vital role as there is significant latency when Lambda function in ap-south-1 region is querying/scanning items from DynamoDB where the data is stored in us-east-1.
This has been implemented with AWS SAM application with NodeJS, the sample code is available on GitHub. {% github zachjonesnoel/aws-dynamodb-operations-with-cloudwatch-custom-metrics/ no-readme %}